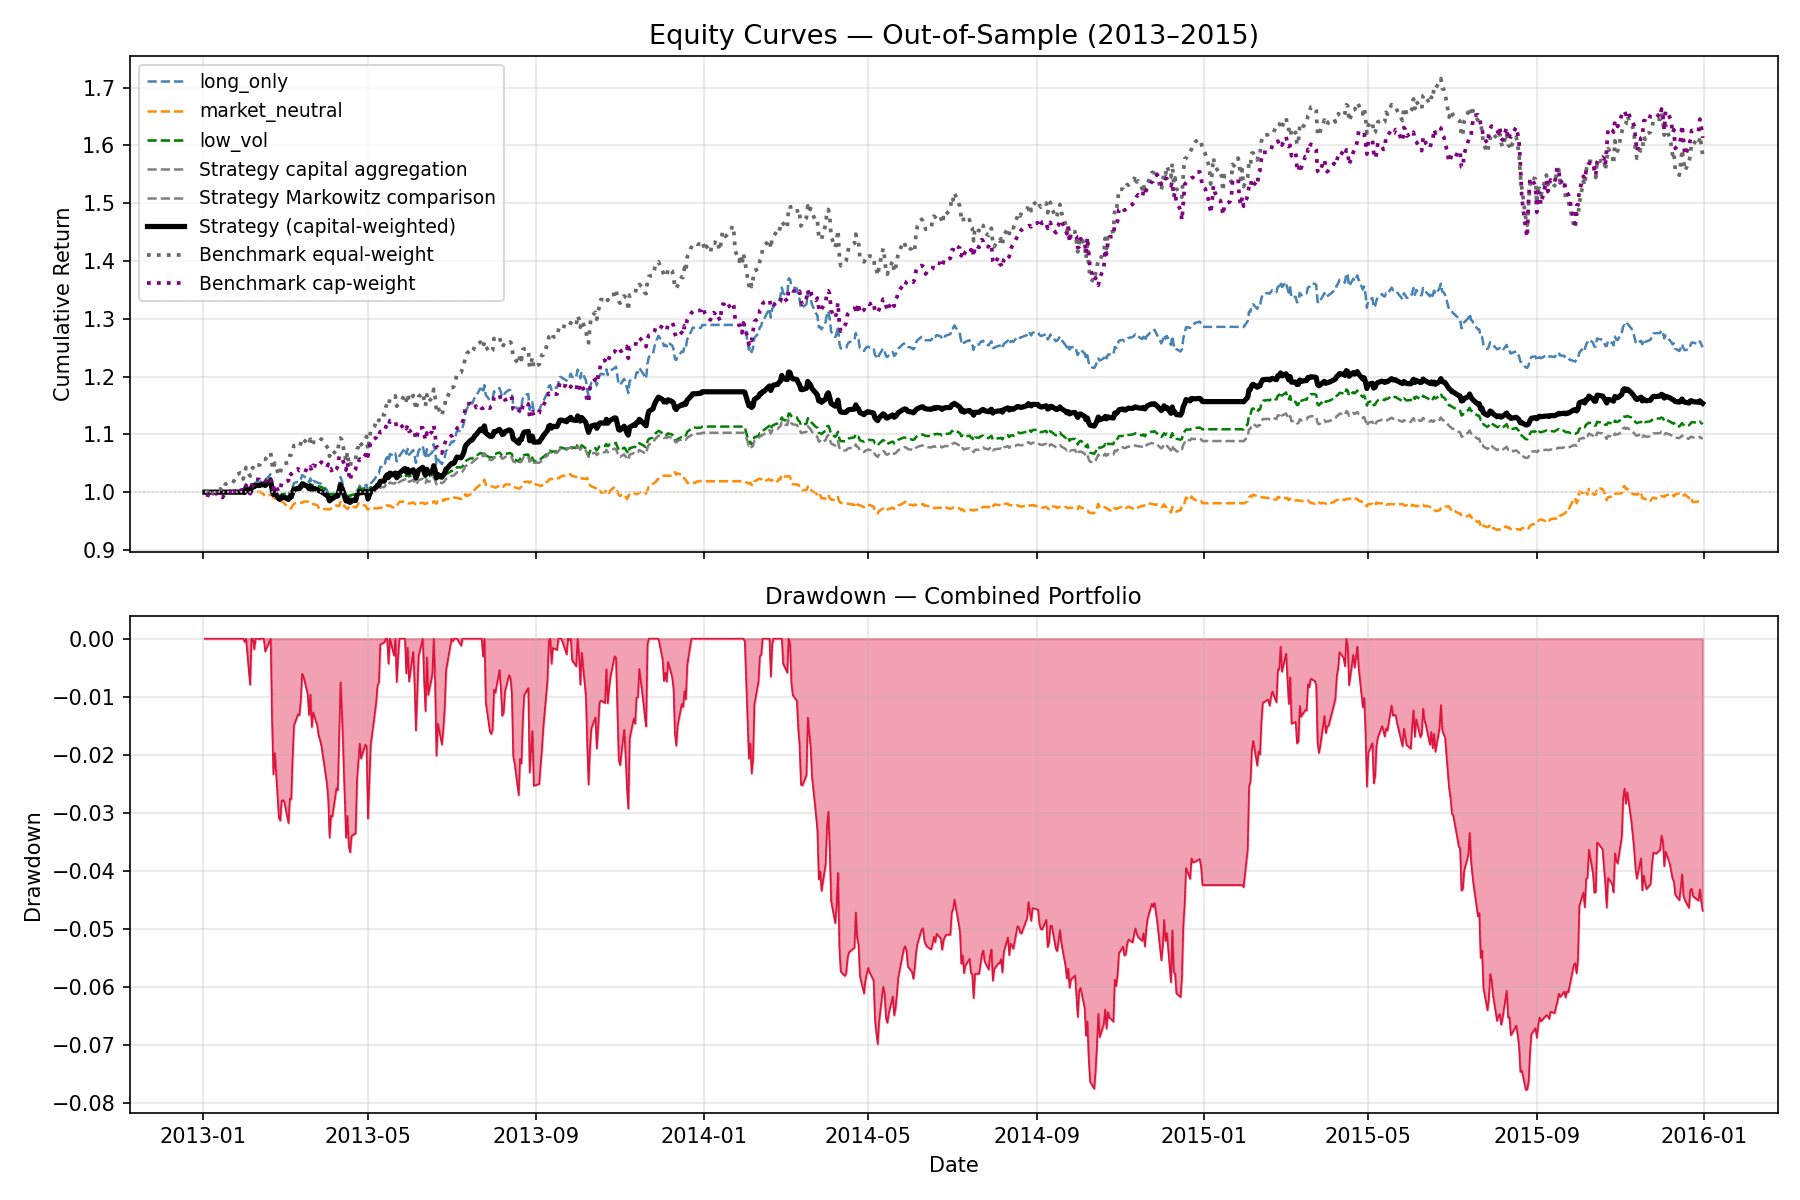
The annual walk-forward out-of-sample window is 2013-2015. The system is shown against two universe benchmarks because a single benchmark would hide the central result: this run does not beat broad-market beta on a risk-adjusted basis.
The system
Sharpe
-0.083
Total return
-2.01%
MaxDD
-9.66%
Equal-weight universe
Sharpe
0.879
Total return
41.65%
MaxDD
-15.29%
Cap-weighted universe
Sharpe
1.012
Total return
43.63%
MaxDD
-12.43%
Interpretation
The system finished at Sharpe -0.083, -2.01% total return, and -9.66% max drawdown. The equal-weight universe finished at Sharpe 0.879 and 41.65% total return; the cap-weighted universe finished at Sharpe 1.012 and 43.63% total return.
That is not an alpha win. It is a useful systems result: the gates prevented LLM-generated ideas from being rubber-stamped, the execution path stayed reproducible, and the final report records that the 2013-2015 bull window rewarded long beta more than a low-beta, market-neutral-inclusive book.
Current synced artifacts are missing the locked final result set or the cap-weighted benchmark, so the page is using the locked final numbers supplied for deploy copy.
Equity curve
Synced image artifact from the results directory.
OOS 2013-2015
Walk-forward discipline
Training and selection are separated from the 2013-2015 OOS window. The page reports the locked annual walk-forward result rather than choosing the best ex-post aggregation.
Benchmark honesty
Both equal-weight and cap-weighted universe benchmarks are shown. The system trails both in Sharpe and total return over this window.
No LLM in PnL
Portfolio construction, allocation, and PnL accounting run through deterministic code. LLM output can enter only after validation gates admit a signal.
Reproducible artifacts
The Next.js showcase reads synced result files from public artifacts. A final sync should be run after the locked result bundle is generated.